Fill out the quick form below or schedule a phone call and we'll get back to you within 1 business hour.

NYC: Python Fundamentals Corporate Training
(6)
Teach your team Python, a powerful programming language, in this beginner course that covers the fundamentals and includes hands-on web and data science projects. They'll gain confidence and practical skills to solve real-life problems while enjoying customized solutions and learning from industry experts.

NYC: R for Data Analytics Corporate Training
(6)
Teach your team the skills and knowledge needed to manage and make sense of the abundance of data in today's digital environment. From the fundamentals of coding to hands-on projects and custom solutions for teams, this course will equip them with the tools for success in data management.
NYC: SQL Corporate Training
(6)
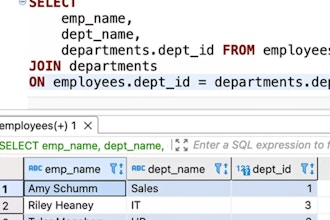
Teach your team how to turn database data into actionable insights by writing SQL queries at this SQL corporate training event. This hands-on training will teach your team to extract specific information, filter data, join tables, and use advanced techniques like subqueries and aggregate functions. It will give them the skills to make data-driven decisions and excel in their role.

NYC: Python for Data Science Corporate Training
(6)
Help your team gain expertise in Python programming for data science, from basic statements to machine learning models, at our Python for Data Science Bootcamp. They'll learn how to work with data in Python, create visualizations, and use statistics to develop machine learning models, all while building a solid foundation in team collaboration and problem-solving.

NYC: Machine Learning Corporate Training
(5)
Give your team the practical skills needed to solve real-world problems with machine learning in this professional development corporate training event. Gain hands-on experience with popular algorithms and learn how to measure accuracy and choose effective features. Perfect for team building and advancing your knowledge in this high-demand field.

Virtual: Machine Learning Corporate Training
In this corporate team training event, learn the practical skills needed to solve real-world problems with machine learning. From cleaning and balancing data to applying machine learning algorithms, your team will gain the expertise to boost their performance and drive success.

Virtual: Power BI Corporate Training
Teach your team how to efficiently solve data issues and create compelling dashboards and data visualizations with Power BI. Your team will gain the skills to connect multiple data sources, create reports, and use Power BI's DAX language, all while building a stronger, more cohesive team.

Virtual: Data Analytics Corporate Training
Teach your team the fundamentals of data analytics and how to use descriptive and inferential statistics for forecasting and decision-making. Gain relevant skills from industry experts and receive custom solutions for your team, including group vouchers and a registration tracking portal, to enhance team building and ensure proficiency in data analytics.

Virtual: Python Fundamentals Corporate Training
Teach your team Python, a versatile programming language, in this beginner-friendly course. They'll gain confidence in programming logic and create code to solve real-life problems, while improving team building skills.

Virtual: SQL Corporate Training
Unlock the power of data with PostgreSQL and SQL and help your team master these essential skills. This hands-on training will teach your team how to extract valuable insights from databases, enhance their decision-making skills, and take on a larger role in your organization's success.

Virtual: R for Data Analytics Corporate Training
Elevate your team's coding skills and build a robust portfolio of projects with a comprehensive course that covers the fundamentals of the R programming language, data management, and visualization. They'll learn from industry experts and leave the training with relevant skills that can be implemented immediately, along with course files to guide day-to-day tasks.
Virtual: SQL Server Corporate Training
Turn data into actionable insights with our SQL Server Bootcamp. Teach your team how to extract information from databases, write SQL queries, join tables, aggregate data, and filter results in this hands-on training, perfect for team building and gaining a larger role in decision-making.

Virtual: Python for Data Science Corporate Training
Join our Python for Data Science Bootcamp and give your team the skills needed to create programs, work with data, visualize insights, and develop machine learning models. This hands-on training will provide a solid Python and data science foundation, fostering team building and empowering your employees to apply their knowledge immediately.

NYC: Data Analytics Corporate Training
Introduce your team to data analytics and statistical analysis fundamentals at this beginner-friendly event. Discover how to use data for decision-making and explore the role of Big Data in today's business world, all while building valuable team skills.

NYC: Power BI Corporate Training
Our comprehensive Power BI training will improve your team's data analysis skills. They'll learn how to connect multiple data sources, create compelling dashboards, and solve pressing data issues while gaining hands-on experience from industry experts.
NYC: SQL Server Corporate Training
Unleash the power of data with our comprehensive SQL Server Bootcamp. Your team will learn how to extract valuable insights from databases, join tables, filter data, and more, empowering them to make data-driven decisions and enhancing their collaboration and problem-solving skills.
1 of 3 pages